Data Logger View
Configure the instrument to log measurements over time. In the Data Logger view, the computer's clock controls measurement start/stop/interval, and readings are stored in a data log on the computer.
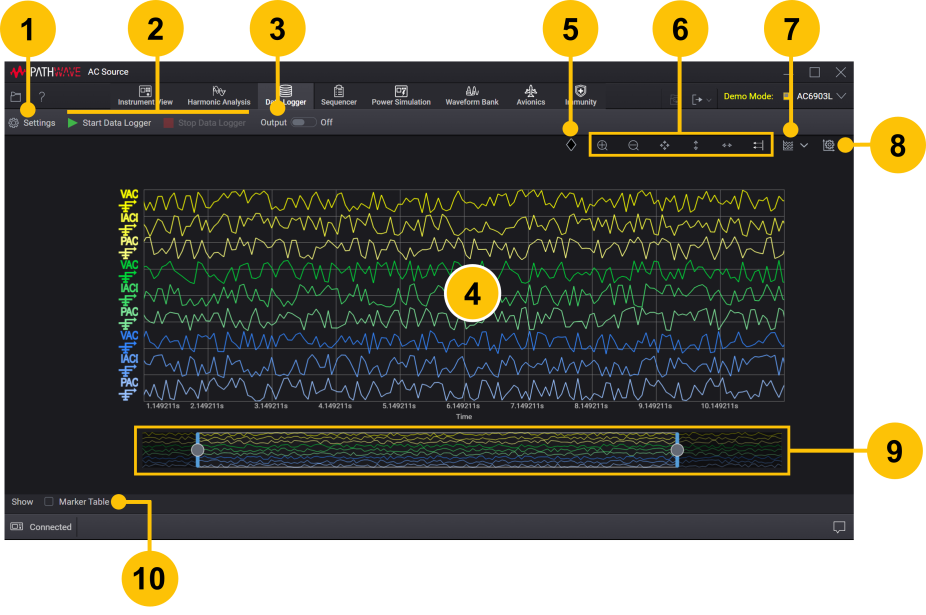
| 1 | Show or hide the Settings panel to configure the Data Logger settings. | |
| 2 | Start and stop data logging. | |
| 3 | Enable or disable all outputs. | |
| 4 | View measurement data in graph view. Click the Start Data Logger button to start data logging. Mouse over the traces to display readings at a point in time. | |
| 5 | Show or hide vertical (X1 and X2) marker pair. Also show or hide horizontal (Y1 and Y2) marker pair when Single Trace view is selected. See Markers. | |
| 6 | Use Trace Display Toolbar to zoom in/out and auto scale the displayed data. | |
| 7 | Show measured data in Multiple Traces or Single Trace view. | |
| 8 | Show or hide the Trace Display settings panel to set the traces thickness, traces color, etc. See Chart Settings. | |
| 9 | Show portion of data currently displayed on chart above. See Data Preview Bar. | |
| 10 | Check to display the Marker Table. The Marker Table shows the trace measurement data based on relative position of each marker. See Markers. |
The data log file size depends on the sample size, selected traces, and data logging duration. Make sure your computer has sufficient disk space when performing data logging.
If your IO connection is especially slow or if communication is disrupted, you will likely experience timing issues during data logging. To avoid these timing issues, be sure your IO connection is adequate and increase your sample period as needed.
During data logging, a chart will be plotted only if the sample size is more than 1.